PREPARATION for the season ahead can come in many forms. I spend way too much time in the garage tinkering with my fishing gear but when I’m not taking stock of equipment my time is often spent on my phone or laptop seeking out new grounds or preparing for an upcoming adventure.
Desktop scouting is a key tool in a technology enabled world; we have an ever- increasing amount of data and information at our fingertips with several useful apps and data analysis methods that can help find new locations or give valuable insights into productive times and times.
Maps and apps
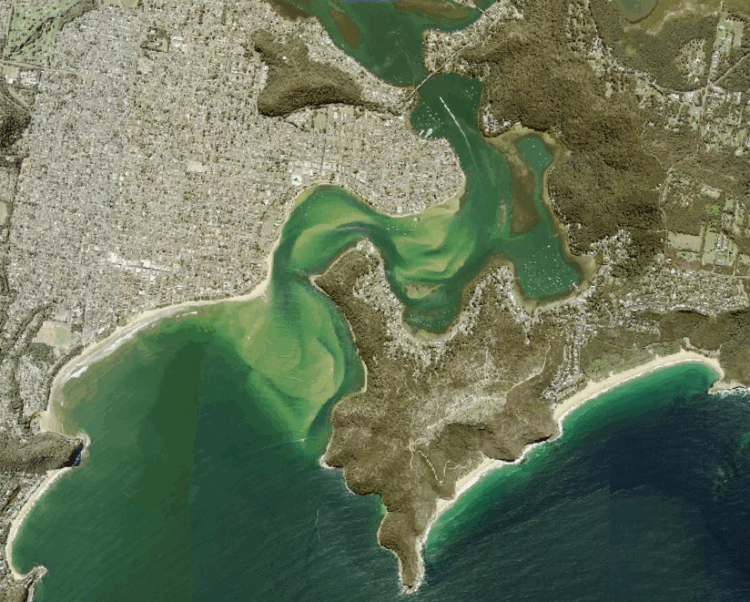
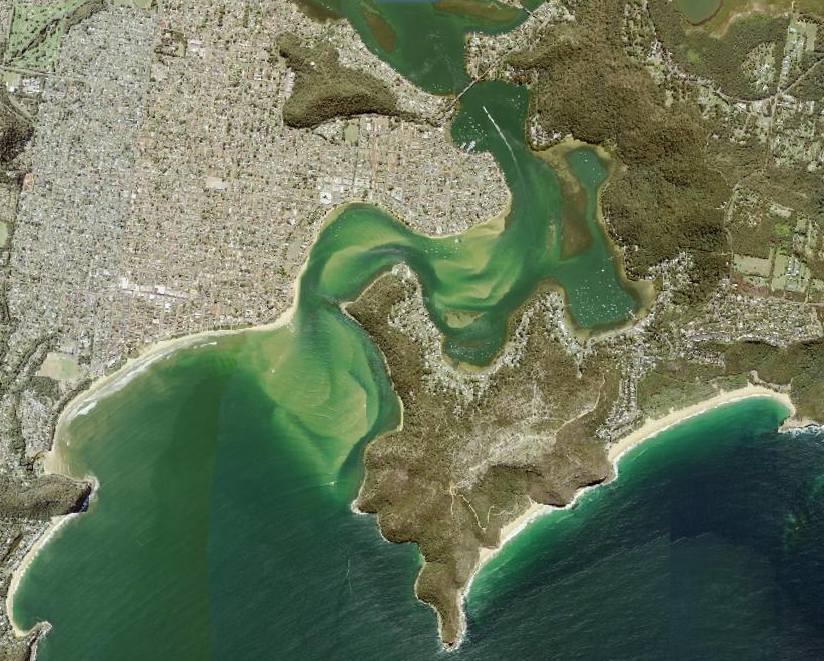
The leadup to Spring and Summer are prime time to scout out new locations. Apps like Navionics and websites like Google maps are great resources to use when planning fishing trips for the season ahead. I have spent hours zooming in on every part of estuary and coastline around Sydney and cross reference this with old fishing articles, maps books, tips from fellow anglers or observations over the years.
The desktop version of Google earth and other satellite imagery sites also allow you to look back at satellite images over time. This can be very useful if you can find images that show locations at different stages of the tide with low tide often revealing fishy looking structures that might be covered when the water levels rise. Marine charts with detailed depth contour information, like what you might find on the Navionics app, provide valuable insights on under water formations with ledges, holes, hard reef, and general depth transitions becoming quite apparent once you gain familiarity with how to interpret the charts.
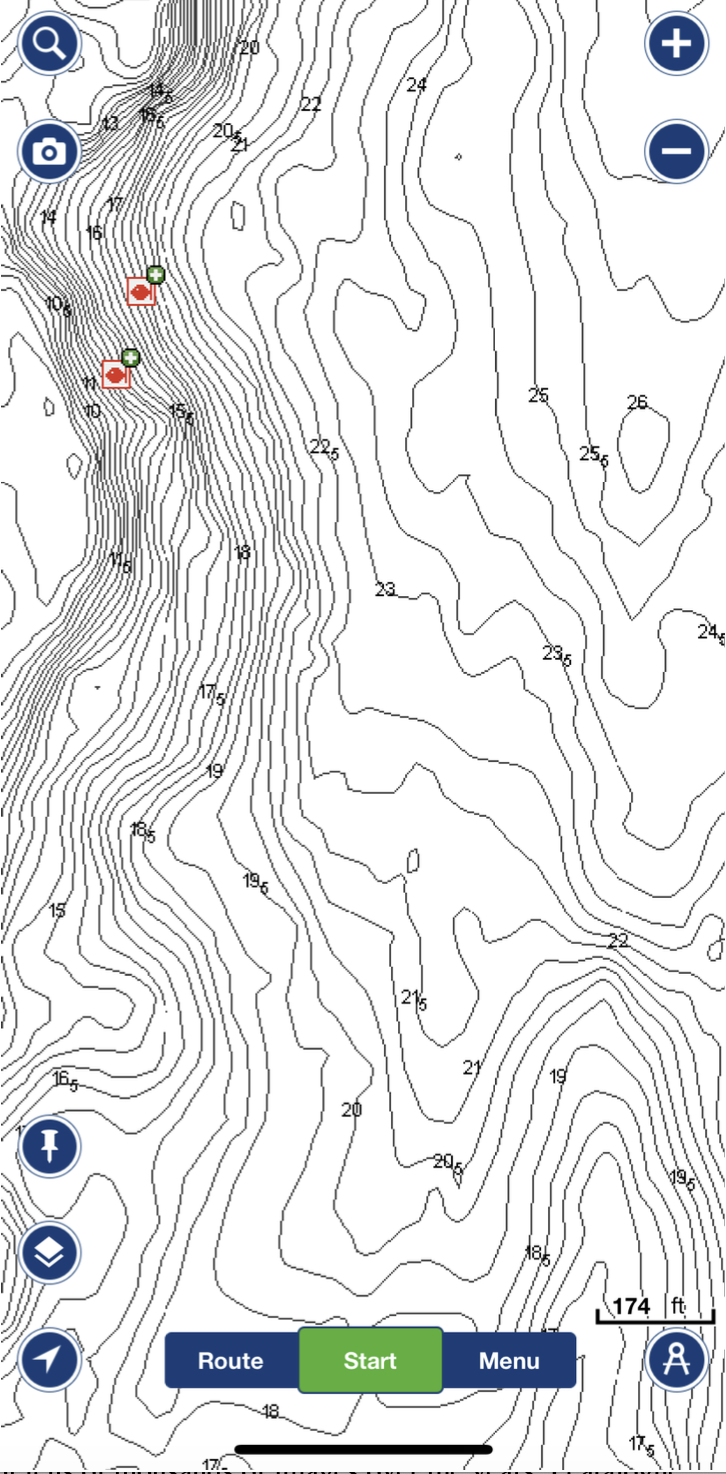
Waypoints overlay
You can take desktop scouting activities one step further by overlaying waypoints and hot spots onto a detailed marine chart. You can do this on a chart plotter if you have one fitted to a boat in the
garage or you can also do this with software like OziExplorer. If you take a close look at any productive way points you will often notice the underwater topography has some element of fish holding structure. Inshore reef structures can be randomly located or follow some type of ridge or fault line and detailed bathymetric maps can highlight these clusters of underwater structure.
If you overlay your waypoints onto these detailed maps, you might notice that one of your hot spots is on one end of a reef system that might extend for quite some distance. If your spot is on the deeper edge of the reef, then similar gradients and depths further along the reef are prime areas to try and only a mouse click away from finding and creating a new waypoint for future exploration.
Photographic intel
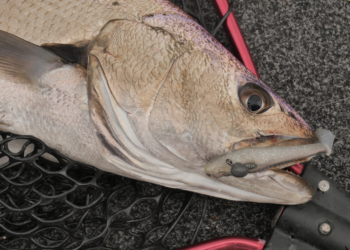
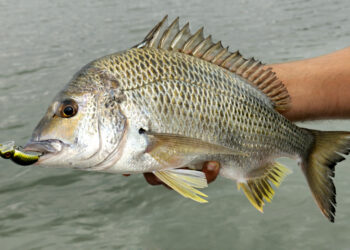
Another valuable piece of desktop scouting involves an accumulation of photos over time. Writing for Fishing World has resulted in a library of tens of thousands of images over the years. I catalogue my images by species and location which helps in finding photos for a story but also provides a valuable resource to know when to target a particular species.
A key point to this is that I take images of all my fish fresh out of the water, so the images accurately represent when the fish was landed. The other piece of the puzzle is keeping a library of annual tide charts on file which you can download from the various state maritime websites. Say for example I wanted to check what the best time to target mulloway in a particular waterway is. I would first search for all mulloway images from that waterway then look through trip specific photos I can piece together how many I might have landed during a particular session. By looking at the time stamp over the years I can see that certain parts of the waterways are more productive at different times of the year. You can then home in on the time of year you want to fish now and look at dates and times of those images then cross reference this data with the tide charts.
This then gives valuable insights on the stage of tide, moon phase and time of day that fish were landed. Once you interpret the data you can gain prized intelligence on the optimal times to target a particular species.
Forecasts and prevailing conditions
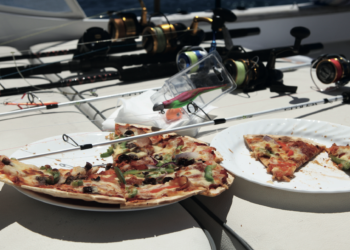
The final task in desktop scouting is reviewing various forecasts and live data to better understand how the prevailing weather conditions will impact an upcoming trip.
The Bureau of Meteorology site gives detailed weather forecasts on wind and sea conditions along with barometric pressure which can help choose optimal days if you have the flexibility of shifting your trip to suit the weather or at the very least will inform what conditions you might end up facing.
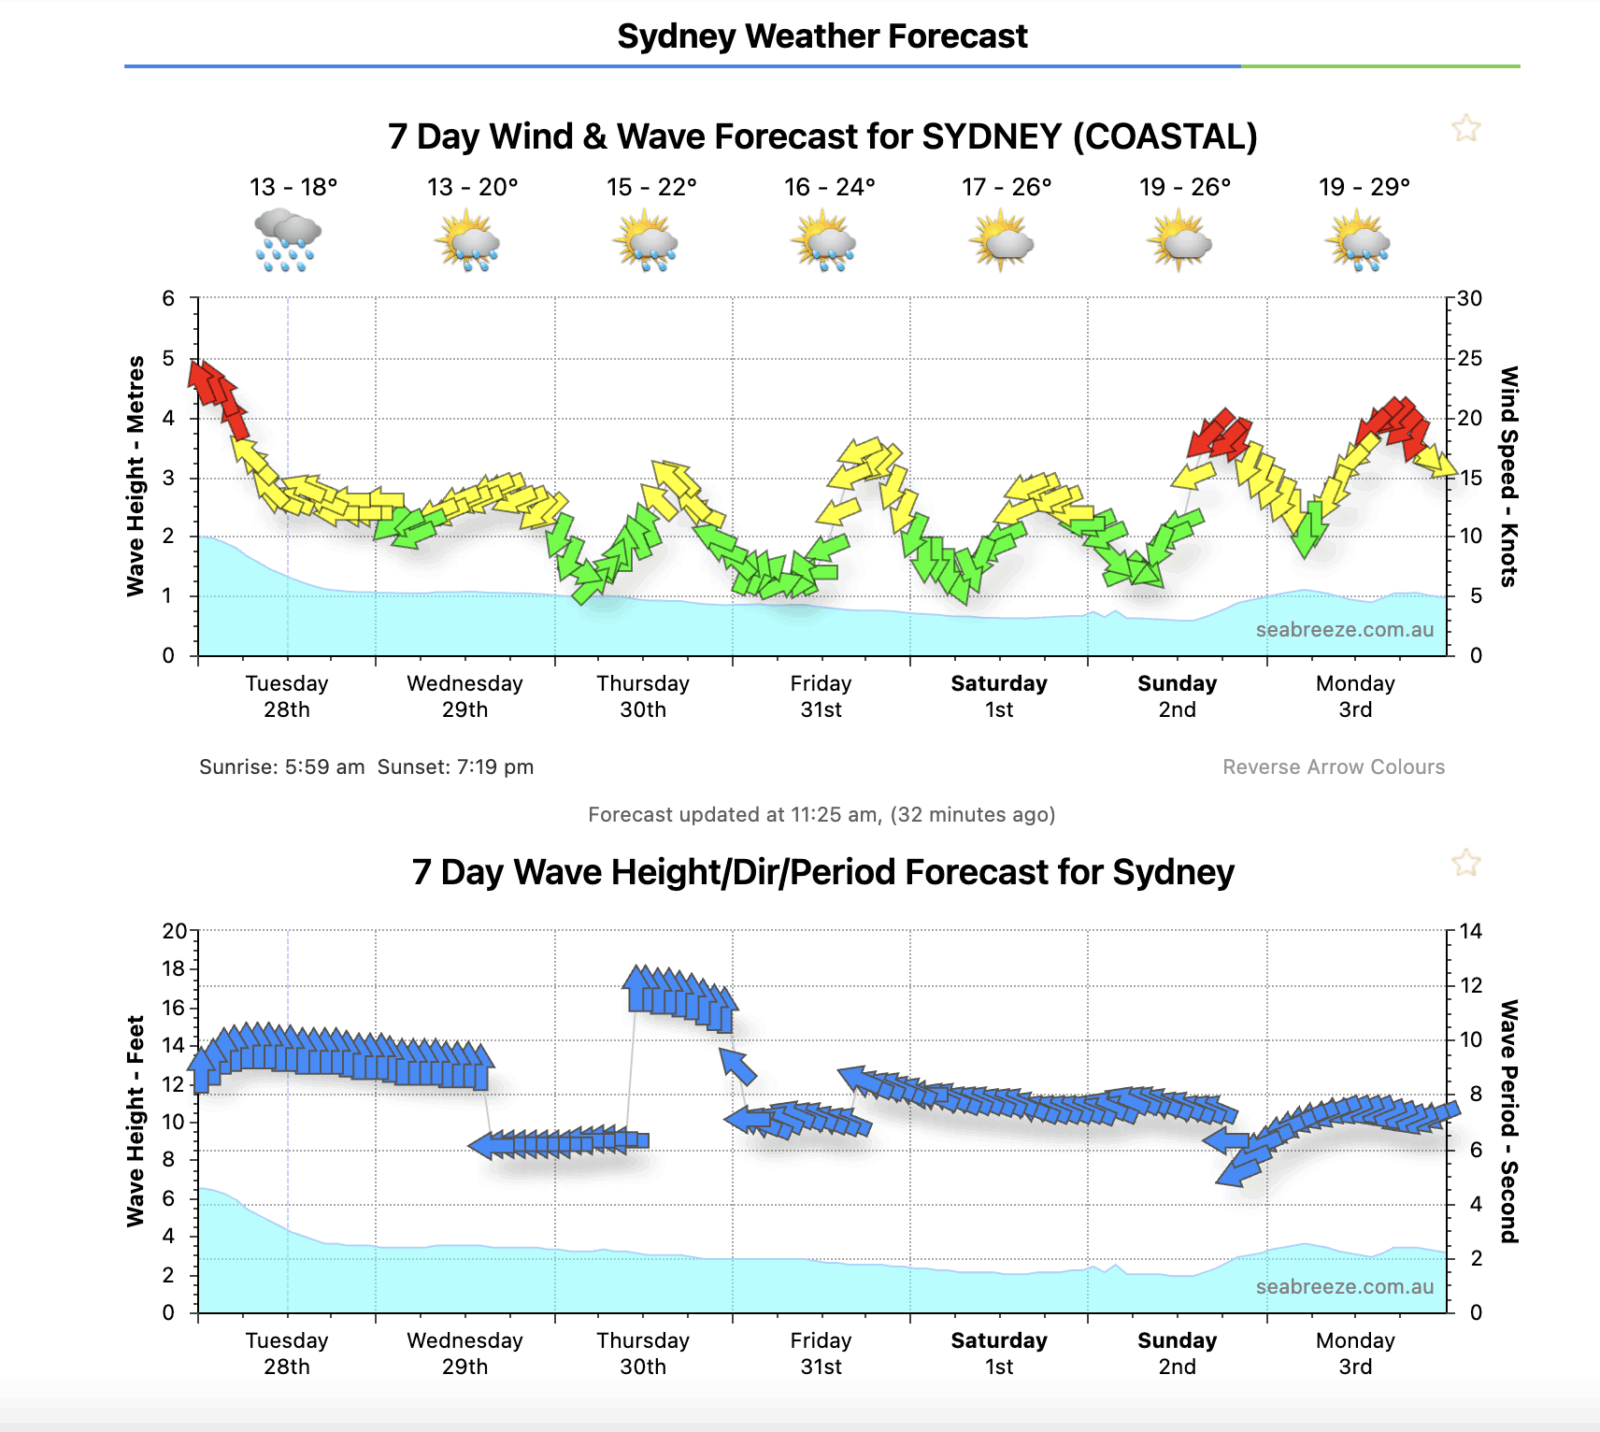
Seabreeze is another useful site that gives live wind data at different locations along the coast; I like to look at the live wind speed and direction at a number of adjacent weather stations to track how the weather fronts are moving up and down the coast. Sea surface temperature charts are another valuable aid that overlay current and surface water temperature information on a coastal map, identifying swirling currents and temperature breaks that could hold vital nutrient streams that in turn attract bait fish and predators.
These are mostly used by offshore anglers chasing pelagic species like marlin and tuna. With the click of a mouse, you can take a waypoint of attractive currents lines and eddies the night before a trip saving hours of trolling and scouting expanses of vast and often featureless open waters.